 Faults of the Bohemian Massif
Source of Analytical Data on Main Faults and Faulted Areas with Seismic Potential
User Tools
Sidebar
database_and_how_to_use_it
Table of Contents
Database
Database is composed of several interconnected sources of data:
- Database of fault sections and their parameters (Fsections shapefile joined with Fparameters table)
- Database of sites with important observations related to fault activity and paleoearthquakes (Fevidence shapefile), and
- Explanation texts (Encyclopedic entries in this web)
Full description of corresponding attribute tables are here PDF.  More details on the structure of the database and the overall strategy are described in this report: Špaček et al. 2020 (alternative link)
Fault in the fault database are described by individual sections with unique parameters. In addition to the usual parameters, we try to capture the quality/accuracy of fault section mapping (field map_q) and information about what observations the fault is locally indicated by (field ind_type).
The database of sites includes the observations bringing counterevidence on fault slip in addition to those with positive evidence.
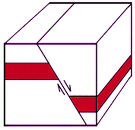
 Fig. 1 Database components
At the moment the primary and only interface connecting to the database is the interactive map (read below). In the future we plan on providing some form of public service that will allow use in your own GIS.
Interactive map
Interactive map is embedded in the Start page and can be also accessed via sidebar or via explanation texts (in the latter by clicking the figure with schematic map).
It shows the fault geometry and the position of localities with important observations on top of zoomable topographic map.
In the current setting the faults are categorized according to their activity and (after zooming in) mapping quality. Classes activity a faultline accuracy correspond to values 1-5 in fields activity and map_q of the database tables Fsections and Fparameters (see attribute tables above).
Sites with local evidence are classified by type, corresponding to the ind_inf and ind_type fields in the Fevidence database.
Clicking any object in a map opens a pop-up window (Fig. 2 left) with listing of selected database field records and hypertext link to explanation text.
Data filtering and querying can be performed using the Filter tool which is activated by clicking the appropriate icon in Details/Content view (Fig. 2 right). Full list of records may be browsed using Table view (Fig. 3).
 & Filter tool (right)")
Fig. 2 Pop-up window (left; opened by clicking the objects in the map), and Filter tool (right; opened by red-circled buttons).

Fig. 3 Table tool activated by red-circled buttons.
Explanation texts
Explanation texts for major faults and local neotectonic observations can be quickly accessed from the sidebar menu list (currently available sub-menus Major faults and Local evidence). The Other faults sub-menu is reserved for faults of more local importance that are currently unavailable.
Each page can be exported to pdf file by clicking on the appropriate button on the far right. The interactive map can be accessed either via startpage or via pages of individual faults.
database_and_how_to_use_it.txt · Last modified: 2025/03/31 10:51 by petrs
Except where otherwise noted, content on this wiki is licensed under the following license: CC Attribution-Share Alike 4.0 International
